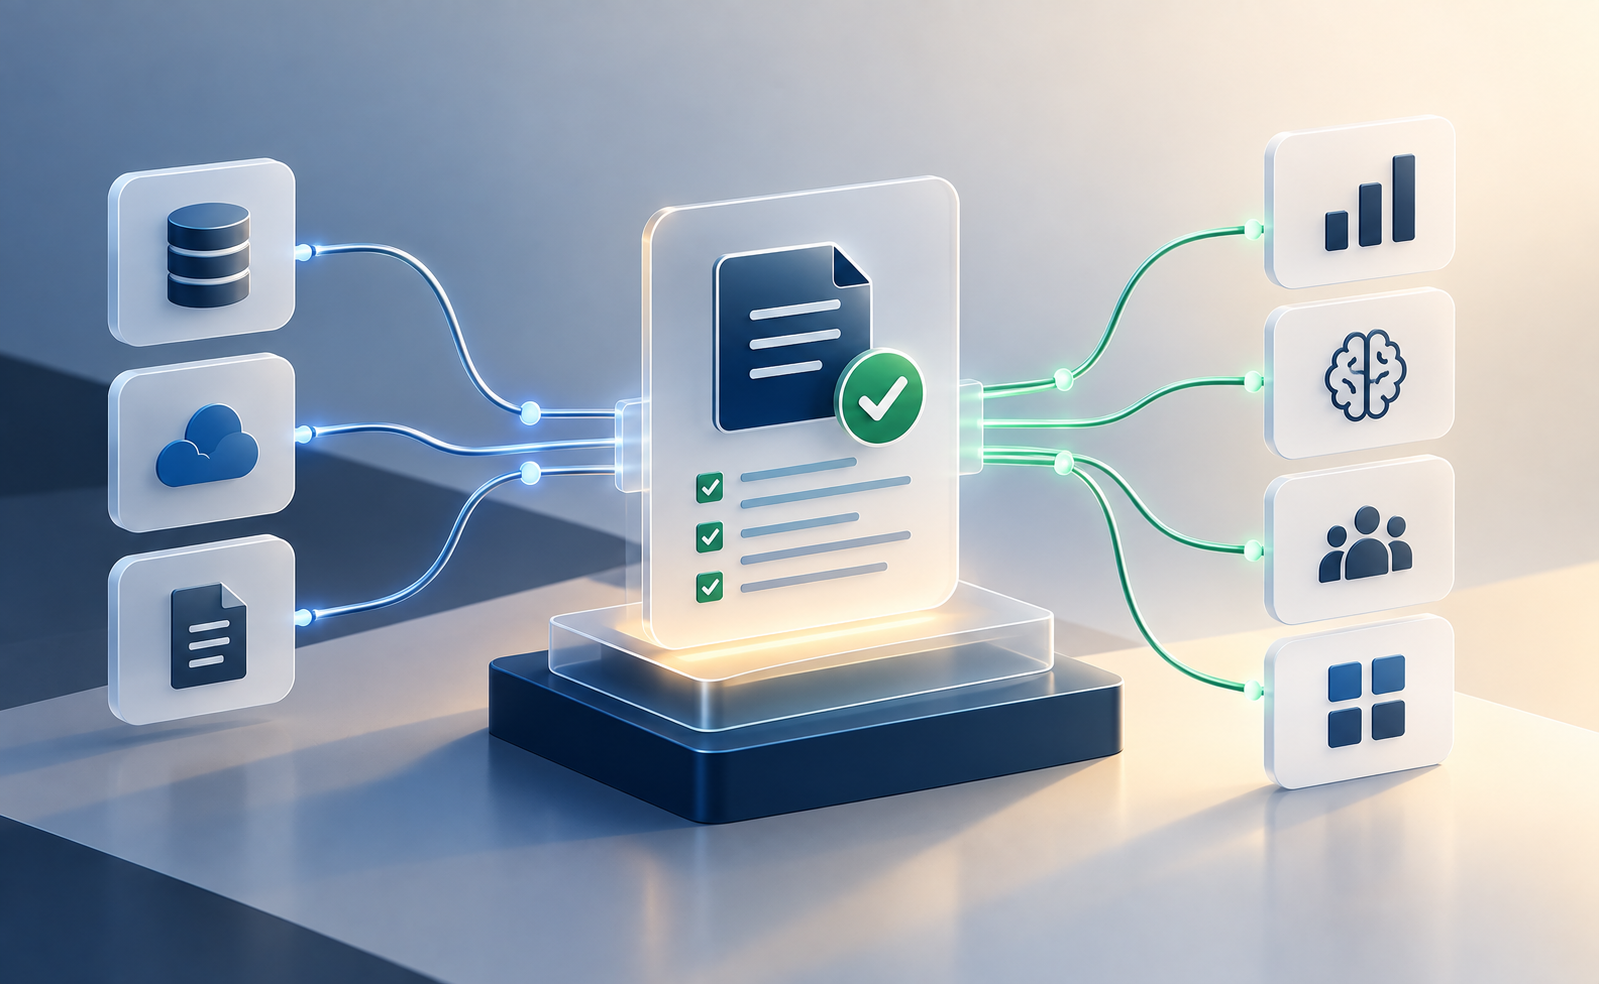
1. The Pipeline Is Green. Is the Data?
A successful pipeline run only means the workflow completed.
It does not guarantee that the resulting data is accurate, complete, consistent, fresh, or safe for downstream analytics and AI.
Think of production data quality as a continuous signal, not a one-time gate.
Data Sources
Four upstream ingest types
DATA HEALTH
Lakehouse
Storage & Governance
Consumers
Downstream consumers
The visual communicates that the pipeline may technically succeed while data health can still deteriorate.
2. What Is Data Observability?
Data observability is the practice of continuously understanding the health of data across the platform.
It is about detecting anomalies and acting before issues impact the business.
Measure
Collect metrics across all data assets.
Detect
Identify anomalies and unexpected changes.
Understand
Analyze trends and root causes with context.
Alert
Notify the right people at the right time.
Act
Remediate issues and prevent recurrence.
3. Lakehouse Monitoring Architecture
A production-ready monitoring layer sits between trusted Delta data and the people or systems that consume it.
Data Sources
Ingestion
Delta Lake
Monitoring Layer
Alerts & Notifications
Consumers
4. Key Data Quality Dimensions
Production data quality should be evaluated across multiple dimensions.
Freshness
Is the data up-to-date?
Completeness
Is all expected data present?
Validity
Does data follow the required rules?
Uniqueness
Are duplicate records controlled?
Consistency
Is data consistent across sources and time?
Distribution & Drift
Has behavior changed unexpectedly?
5. Example Data Quality Metrics
The source provides specific example thresholds.
| Dimension | Metric | Example Threshold |
|---|---|---|
| Freshness | Max data delay | < 15 min |
| Completeness | Expected record volume | > 95% |
| Validity | Critical null rate | < 1% |
| Uniqueness | Duplicate rate | < 0.5% |
| Drift | PSI compared to baseline | < 0.25 |
6. Detect Data Drift Early
Identify distribution changes before they impact reports, dashboards or ML models.
Baseline (Expected)
Reference NormalExpected statistical bell-shaped curve
Current (Detected Drift)
Current distribution no longer matches expected baseline
Early detection prevents wrong decisions, failed models and loss of trust.
7. When a Signal Goes Red
When a monitoring threshold is breached, the response should follow a structured sequence.
Detect
Monitoring sees the breach.
Investigate
Analyze root cause and context.
Alert
Notify the correct owners.
Remediate
Fix or rollback to last good state.
Verify
Re-check and confirm health.
8. Traditional Data Quality vs Modern Observability
The source compares a traditional pipeline-centric approach with modern lakehouse observability.
Traditional Approach
Legacy- Periodic manual checks
- Pipeline-centric
- Reactive (find issues late)
- Static rules
- Siloed alerts
- Harder to scale
Modern Observability with Lakehouse
Modern Standard- Continuous monitoring & automated checks
- Data-centric
- Proactive (prevent issues early)
- Dynamic thresholds & anomaly detection
- Unified alerts & integrations
- Built for scale and real-time data
9. One Trusted Data Signal
The same data-health layer can support dashboards, BI reports, ML models, RAG systems and AI agents.
Quality must be universal because every consumer depends on the same underlying truth.
Trusted Data
Central Continuous Health Layer
Dashboards
Operational visibility
BI Reports
Executive analytics
AI Agents
Autonomous actions
RAG Systems
Retrieved knowledge context
ML Models
High-accuracy predictions
10. Real Business Benefits
The blog identifies five business outcomes.
Confident Decisions
Trust metrics, reports and AI outputs.
Reduced Incidents
Catch data issues before customers do.
Operational Efficiency
Less manual checking, more automation.
Better AI Outcomes
High-quality data = better models.
Stronger Data Culture
Make data quality everyone's priority.
11. The Abilytics Perspective
Great Data Engineering Is Measurable
A healthy data platform should make quality visible.
Instead of asking:
“Did the job finish?”
teams should ask:
“Is the data behaving as expected, and can the business trust it?”
That shift - from pipeline monitoring to data observability - creates a stronger foundation for analytics, machine learning, RAG and AI applications.
At Abilytics, we help organizations design observable, governed data platforms that detect quality risks early and turn trustworthy data into business outcomes.