Problem Statement
A company has migrated to AWS and wants to analyze its cost and usage data to optimize its AWS spending.
Services Used
Flow

Details
The following steps comprise a high-level flow of how the setup is performed:
Step 1: Enable AWS Cost Explorer
To enable Cost Explorer, the company can navigate to the Cost Explorer dashboard and follow the on-screen instructions. Once enabled, Cost Explorer can be used to retrieve cost and usage data for various AWS services.
Step 2: Power Scheduling
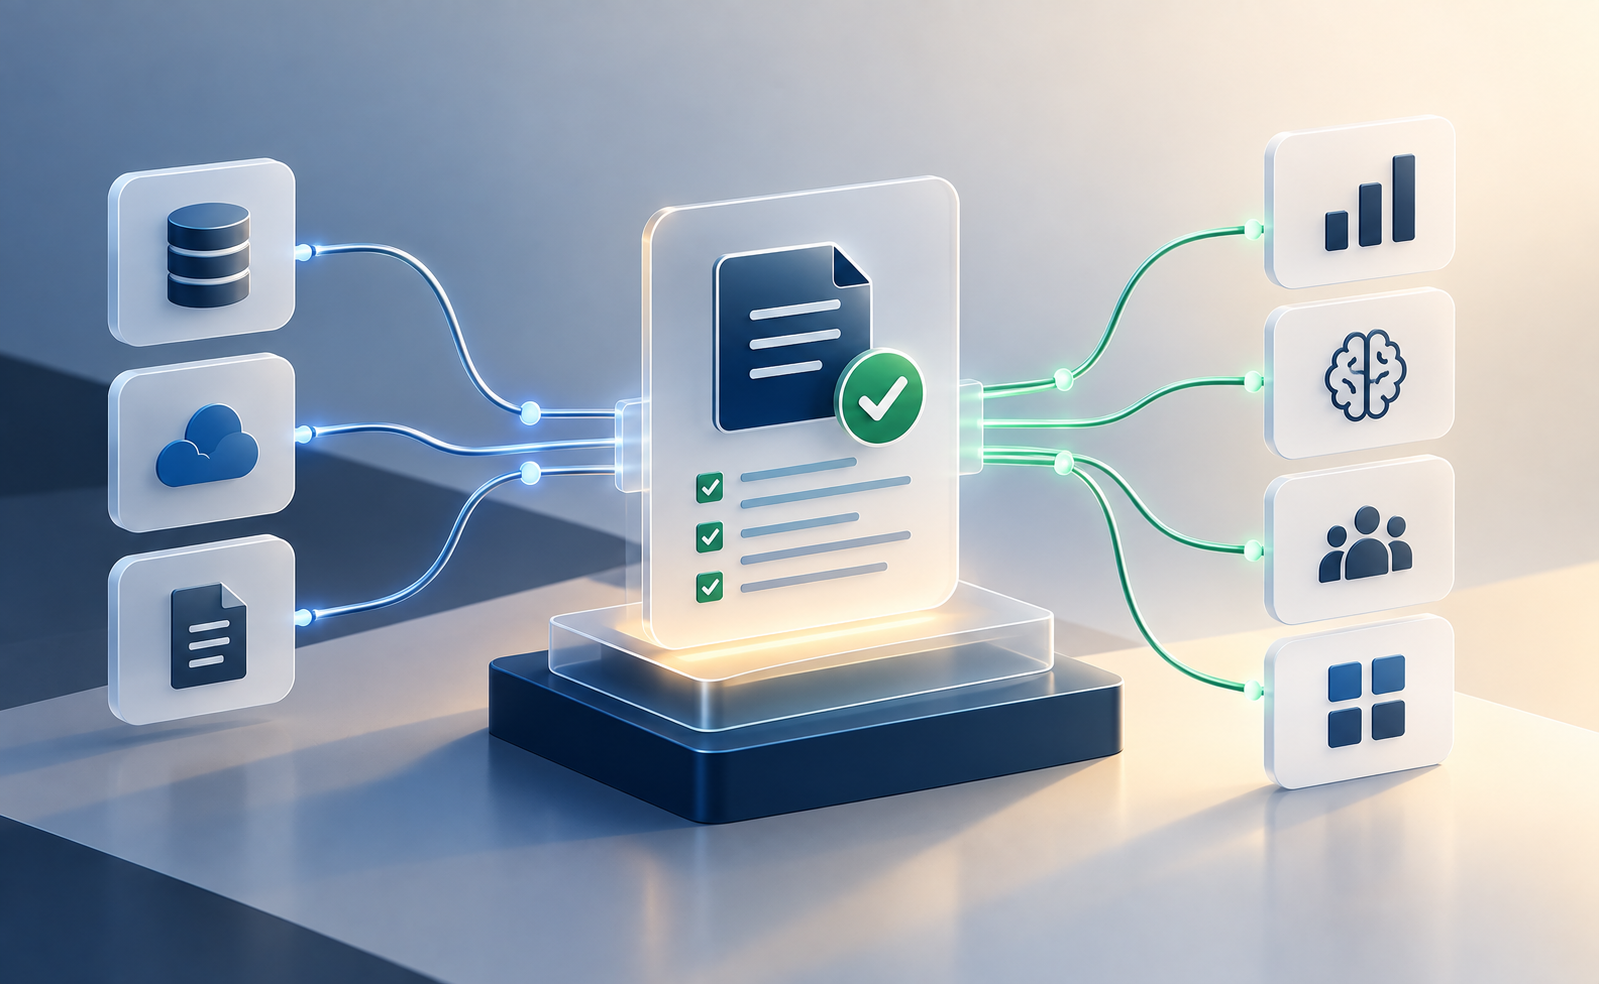
To retrieve the cost and usage data, the company can use Lambda to call the Cost Explorer API and retrieve the data in JSON format. The retrieved data can then be optimized to a CSV format using Python code and posted to an S3 bucket for storage and future analysis.
Step 3: Push Data from S3 Bucket to OpenSearch with Lambda
To push the data from the S3 bucket to OpenSearch, the company can use Lambda to reference the CSV formatted file, convert it to JSON indexed format, and push it to OpenSearch. The data can be indexed by setting up an OpenSearch cluster in AWS and configuring it to accept the data.
Step 4: Analyze Cost Data using OpenSearch
With the data indexed in OpenSearch, the company can use complex queries to analyze and gain insights into their AWS spending. The company can create dashboards and reports using Kibana, a visualization tool integrated with OpenSearch. The company can also use various plugins available with OpenSearch to extend its capabilities.
Step 5: Visualize Data using QuickSight
To visualize the data and gain a better understanding of their AWS spending, the company can connect QuickSight to OpenSearch as a data source. The company can then create interactive dashboards and reports using QuickSight's business intelligence tools. QuickSight provides a range of visualization options such as pie charts, bar graphs, heat maps, and scatter plots. The company can also use QuickSight's machine learning capabilities to create predictive models and identify trends in their data.
Conclusion
By combining AWS Cost Explorer, S3, Lambda, OpenSearch, and QuickSight, the company can get a comprehensive view of their AWS usage and costs. This can help the company optimize their infrastructure, reduce costs, and improve overall efficiency.